Stop Flying
Blind on Amazon.
Your Seller Central dashboard tells you revenue went up or down. It doesn't tell you why. Mission Control gives you the financial intelligence of a CFO — automated, always current, and built specifically for Amazon FBA economics.
Build costs start at $9,999 · Session fee credited toward your build
Mission Control for
Amazon Sellers
We built Mission Control as a custom AI-powered command center for serious Amazon sellers — the kind who run 7-figure operations and need more than what Seller Central provides. Every feature is designed around one goal: giving you the exact data you need to make faster, more profitable decisions.
This isn't a SaaS dashboard you subscribe to. It's a bespoke system we build for your business, connected to your accounts, tuned to your margins, and monitored 24/7 by AI.
Everything we've built
for your Amazon business.
Each module is purpose-built for FBA economics. Together they give you a level of business intelligence most sellers never have.
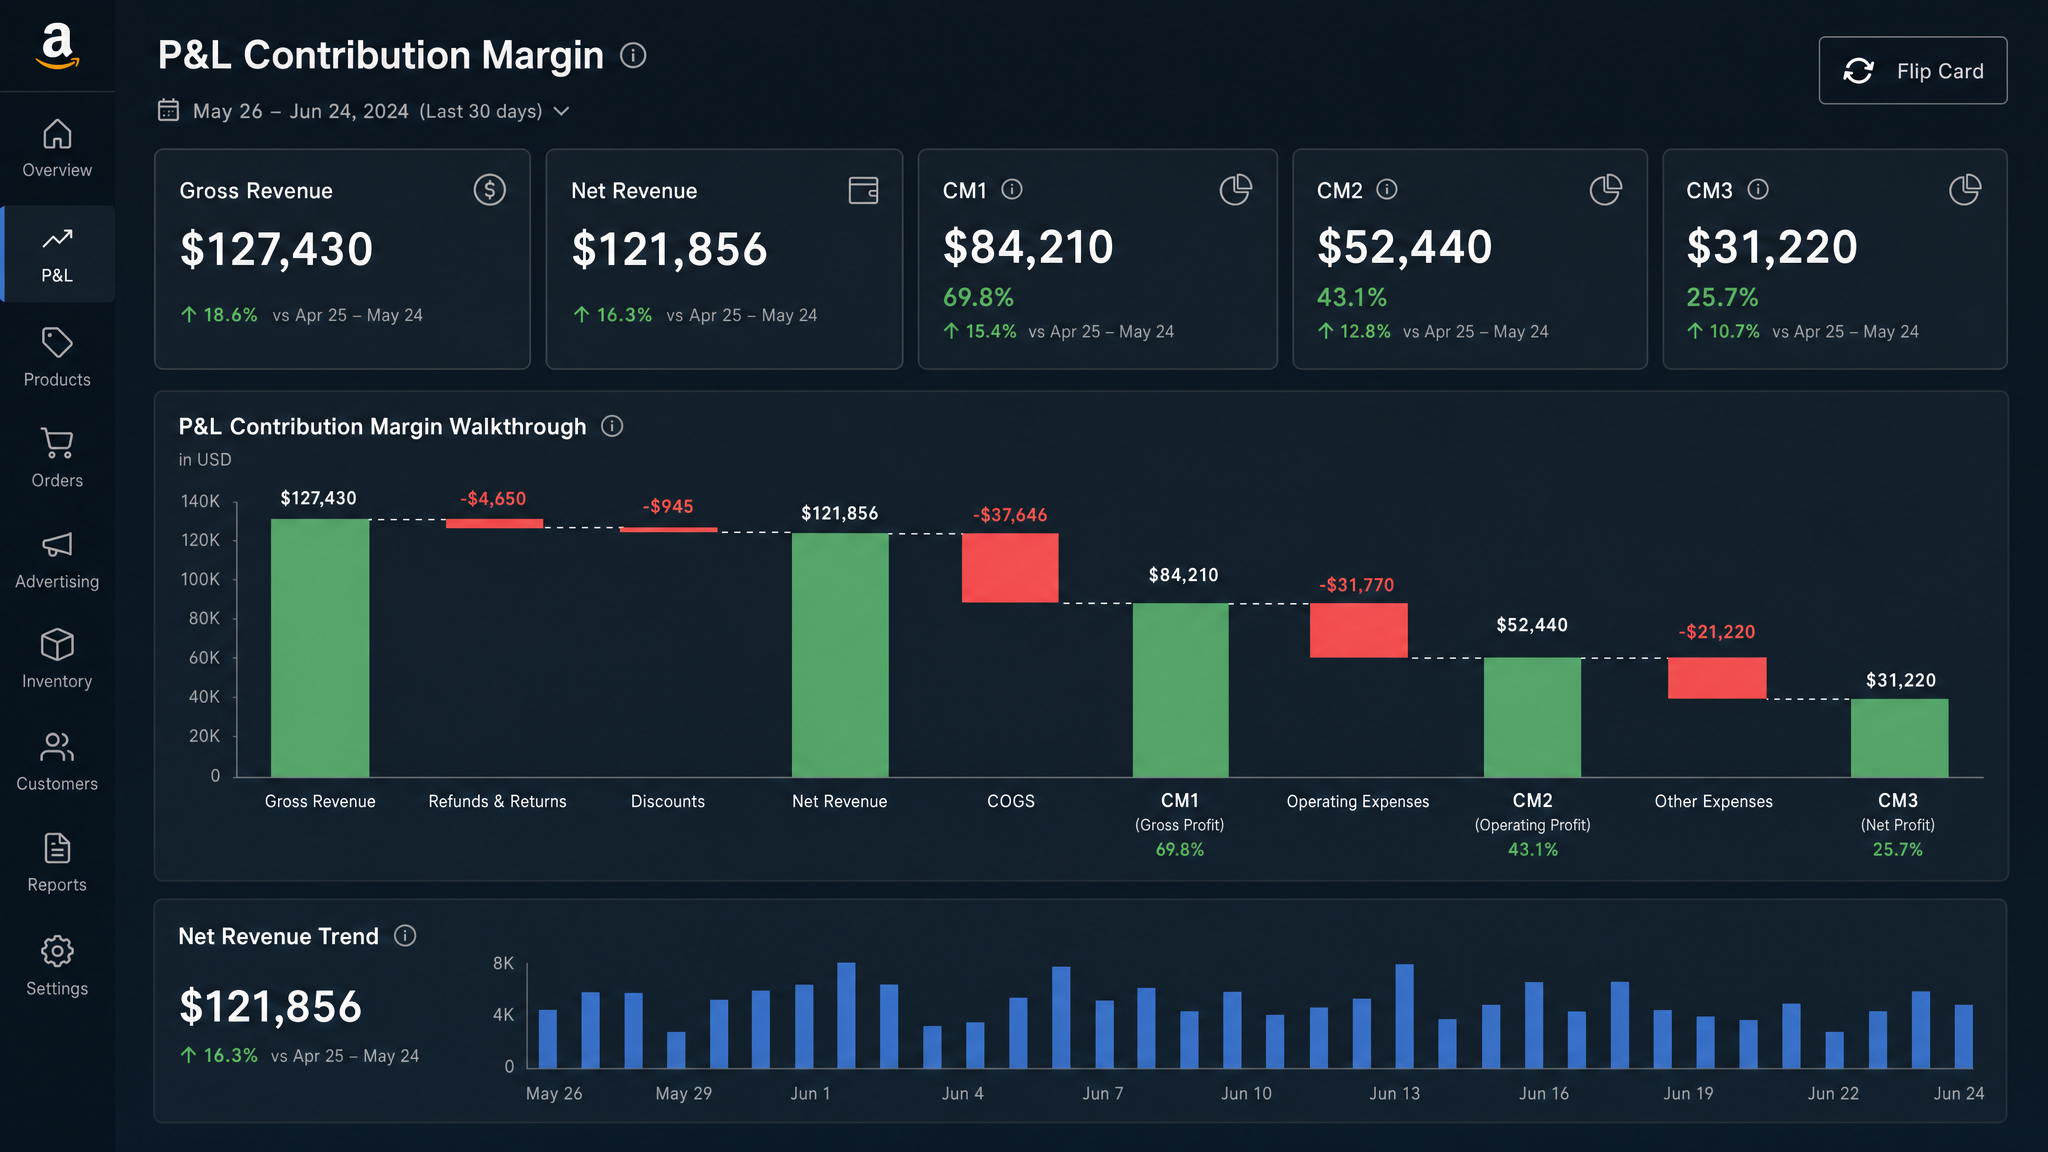
Financial Intelligence — P&L, Margin Waterfall & Fee Forensics
Contribution Margin Waterfall
Real-time P&L broken into three layers — CM1 (after COGS), CM2 (after Amazon fees), and CM3 (after ad spend). Supports any date range: today, yesterday, month-to-date, last month, or fully custom.
Full Fee Line-Item Breakdown
Every Amazon fee broken out individually: FBA Per Unit, Referral, Storage, Long-Term Storage, Inbound Transportation & Placement, Removal, Returns, Disposal, Clawback, Vine, Lightning Deals, Warehouse Damage/Lost, Reimbursement Reversals, and more — 20+ categories tracked.
SC-Verified Historical P&L
Every month verified against actual Seller Central data — locked in a manual overrides system with SC-exact numbers. Covers from your very first month on Amazon through today. No estimates, no guessing.
Most sellers only know their net payout. We show you exactly where profit leaks — is Amazon fees eating 35%? Is ad spend collapsing CM3? When you see that long-term storage costs $1,200/month or removal fees spiked to $400, you act: liquidate slow inventory, adjust reorder quantities, reprice. We've seen sellers cut Amazon fees 15–20% within 60 days of getting this visibility. Accurate historical data means accurate trend analysis — you can't optimize what you can't measure.
Product & ASIN Intelligence
Full catalog intelligence with actual FBA fee per unit (pulled from real settlement data — not estimates), landed cost, manufactured cost, B2B/B2C price tracking, and parent/child ASIN relationships mapped across your entire catalog.
Knowing your true margin per ASIN reveals which products to scale and which to cut. A product with $30 revenue but $8 FBA fee + $5 referral + $4 storage + $3 COGS is barely breaking even. Seeing this at the ASIN level changes sourcing decisions instantly — stop chasing revenue, start chasing margin.
Replenishment Planner
Calculates sell-through velocity per ASIN across 30/60/90-day windows, days of stock remaining, reorder point, and suggested order quantity. Automatically flags stockout risk before it becomes a crisis.
Stockouts are one of the #1 killers of Amazon rank and revenue. Going out of stock for even 3 days can tank BSR and take weeks to recover. Automated replenishment alerts mean you always reorder at the right time — not too early (ties up capital) and not too late (loses rank).
Advertising Intelligence — SP, SB & SD
Full PPC breakdown across Sponsored Products, Sponsored Brands, and Sponsored Display. Shows spend, sales, ACoS, TACoS, clicks, and units with 14-day attribution windows and B2C vs B2B performance split.
TACoS — ad spend as a % of total revenue — is the real profitability metric. Most sellers only see ACoS. But if organic sales are high, TACoS can be healthy even when ACoS looks elevated. We show both so you scale ad spend with confidence.
Dayparting Heatmap
A 24-hour × 7-day grid showing ad spend and sales by hour and day of week — built from Amazon Marketing Stream hourly data. See exactly when your ads convert and when they waste budget.
If Tuesday evenings convert at 2× the normal rate, you should be bidding 50% higher. If Sunday mornings burn budget with zero conversions, cut bids. This single feature can improve ACoS 10–15% with zero additional spend — just smarter allocation of what you're already spending.
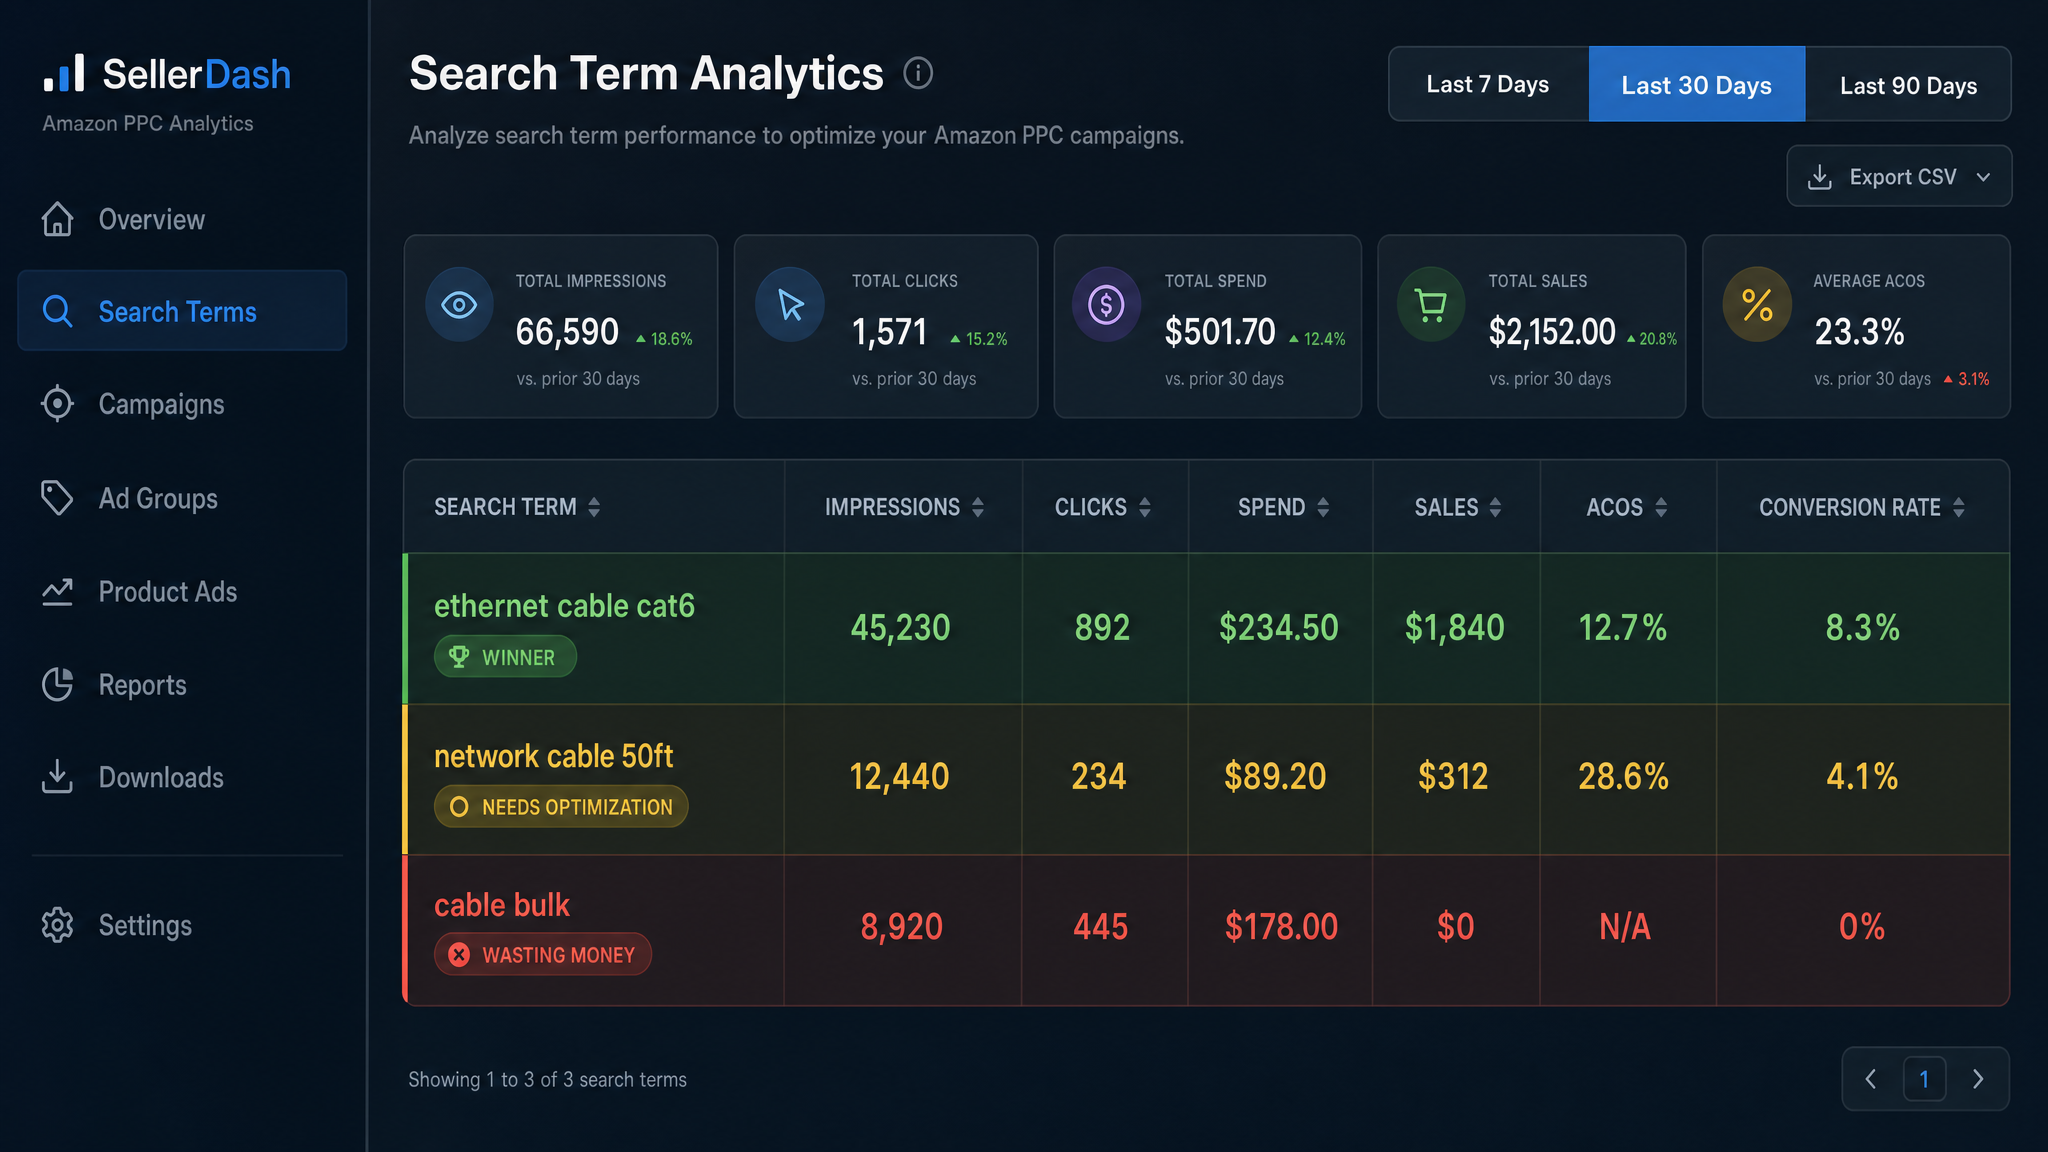
Search Term Report — Keywords Intelligence
Visual dashboard showing every search term that triggered your ads — with clicks, spend, sales, ACoS, and conversion rate. Filter by short-term (last 7–14 days) vs long-term (30–90 days) performance. Color-coded to instantly spot winners vs money-wasters.
This is where most sellers hemorrhage ad money. A search term can look fine over 30 days but be destroying budget this week. Or a term that looks unprofitable short-term is actually building rank long-term. Seeing both timeframes side by side is the difference between reactive and strategic bid management. Sellers routinely find they're spending 20–30% of ad budget on irrelevant terms.
Traffic & Conversion Metrics
Sessions, Unit Session % (conversion rate), Buy Box %, and CVR — pulled from Amazon's Business Reports. Broken down by B2C vs B2B and organic vs PPC so you always know which traffic source is performing.
Low CVR with high traffic = listing problem. High CVR with low traffic = visibility problem. Knowing which lever to pull is the difference between fixing the root cause vs throwing money at ads. Most sellers guess. You won't have to.
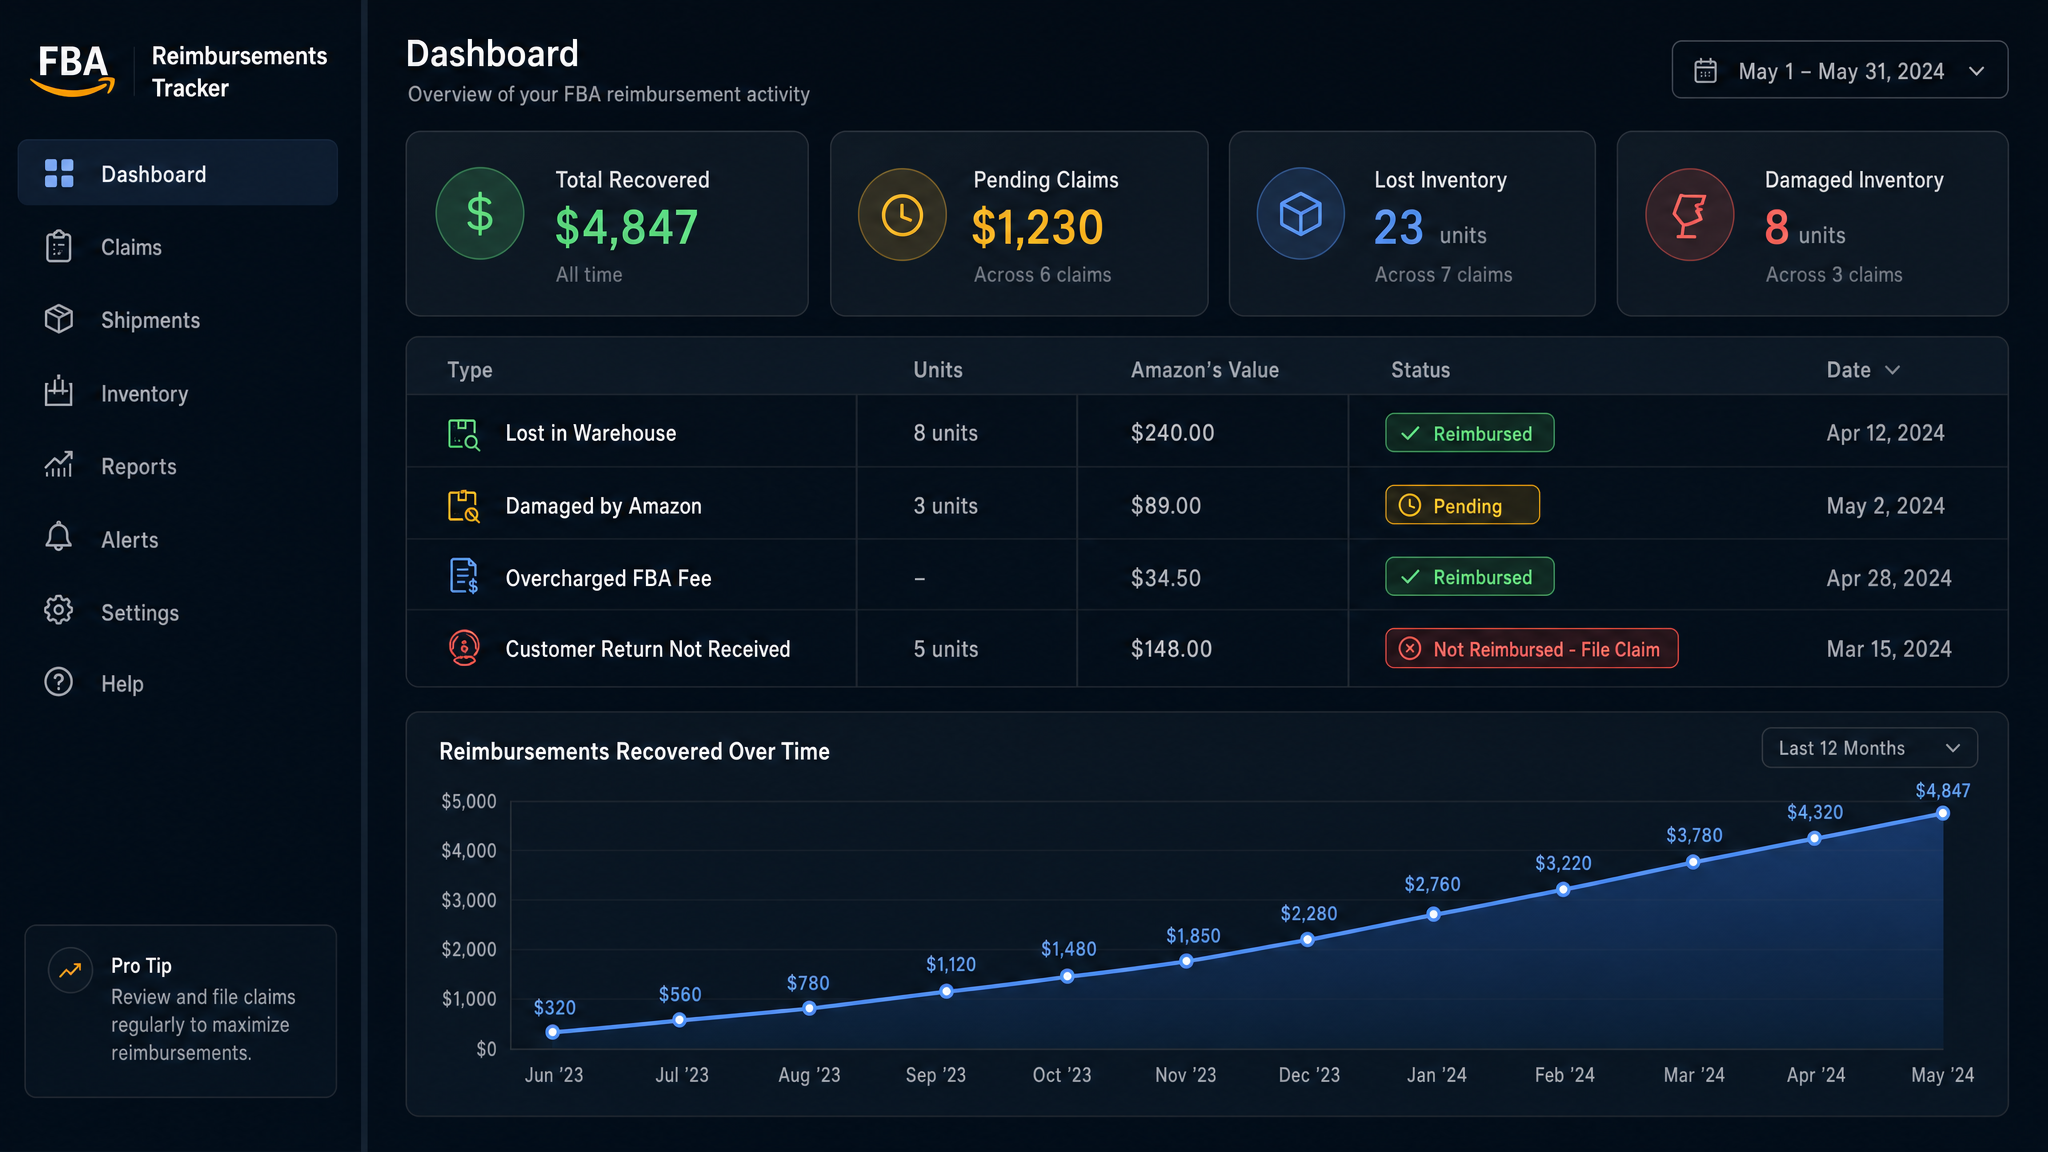
Reimbursements Tracker
Amazon owes sellers money constantly — for lost inventory, damaged goods, overcharged fees, and failed returns. Our system tracks every reimbursement Amazon has paid vs what they owe, flags discrepancies, and shows the running total you've recovered.
The average FBA seller is owed $1,000–$5,000+ in unreimbursed inventory losses at any given time. Amazon's system doesn't automatically surface these — you have to know to look. Our tracker does it automatically. This is pure recovered profit with zero additional work.
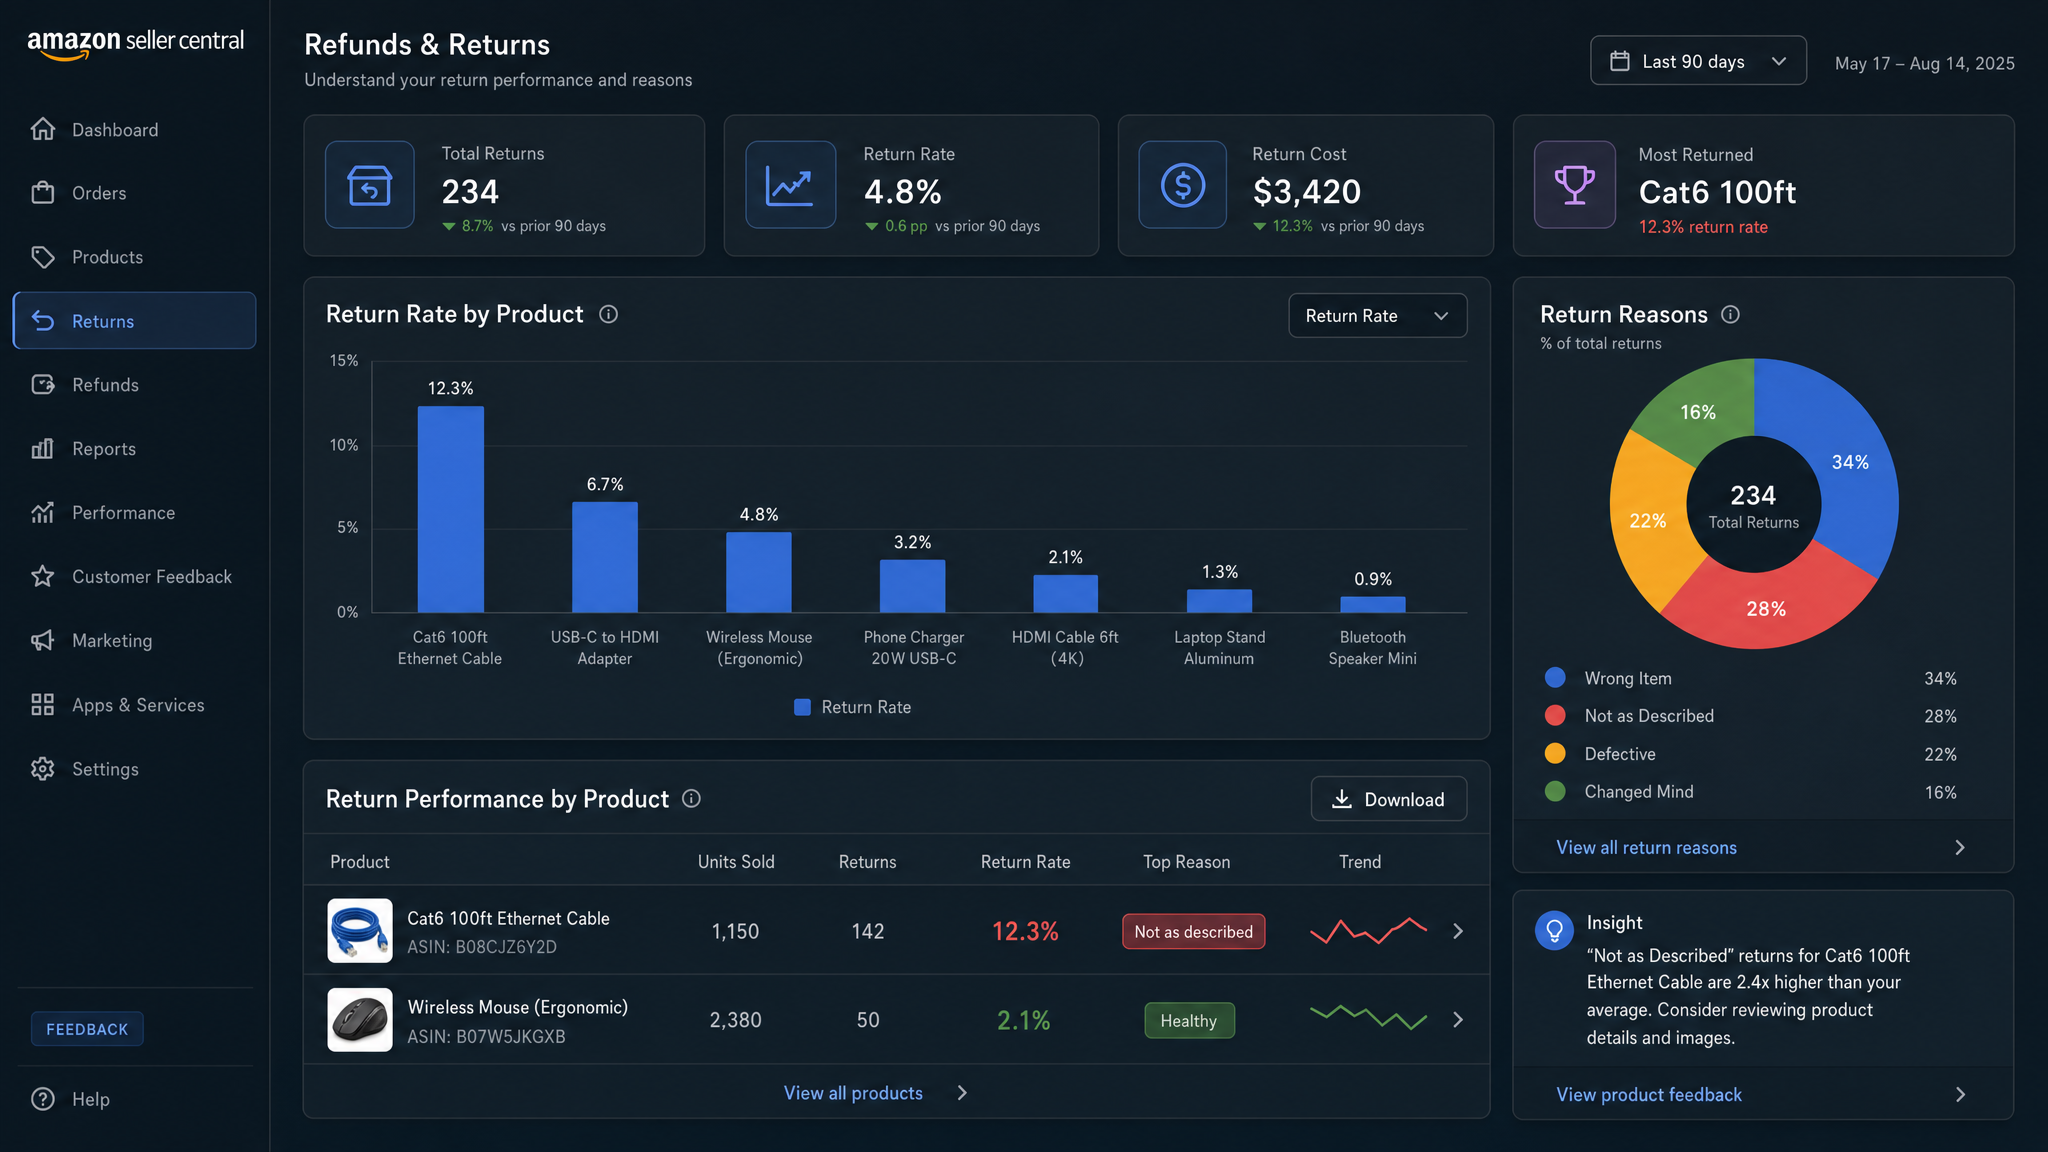
Refunds & Returns Intelligence
Return rate per ASIN, return reason breakdown, trend over time (is return rate climbing?), cost impact of returns, and which products are above benchmark — all in one view.
A 15% return rate on one product is a listing problem, a quality problem, or a customer expectation mismatch — and it's fixable. Most sellers only see "Refunds: $2,400 this month" with no idea which ASIN is causing it or why. We break it down by product and reason so you can act: improve listing photos, update descriptions, fix a quality issue with your supplier.
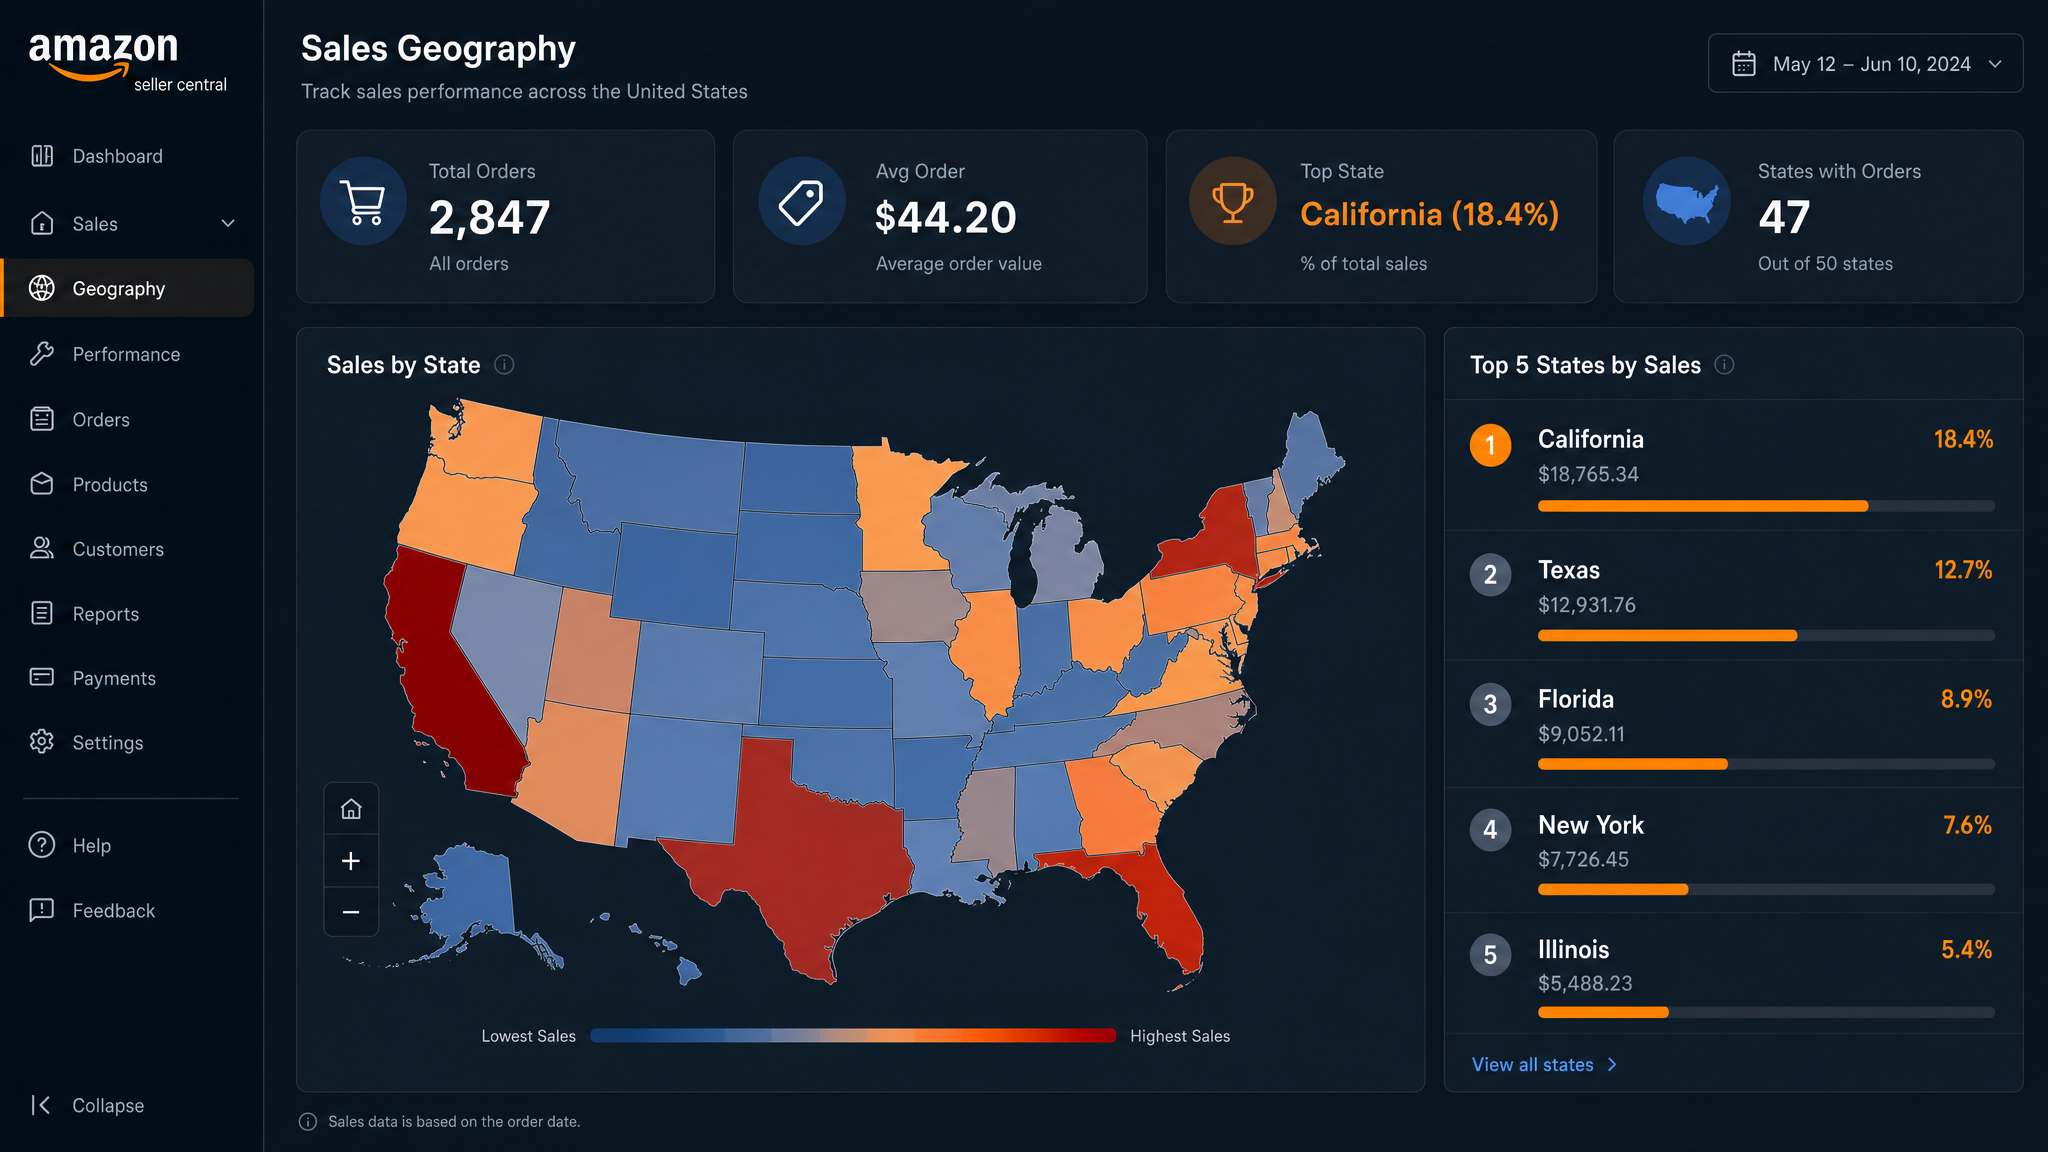
US Sales Map
Geographic heatmap of all orders across the US — by state and region. Shows revenue concentration, order density, and which markets are growing or declining over time.
Knowing where your customers are unlocks smarter decisions — targeted ads by geography, identifying untapped markets, and optimizing FBA placement. If 60% of your orders come from the East Coast but inventory is split evenly, you're paying unnecessary shipping costs every single day.
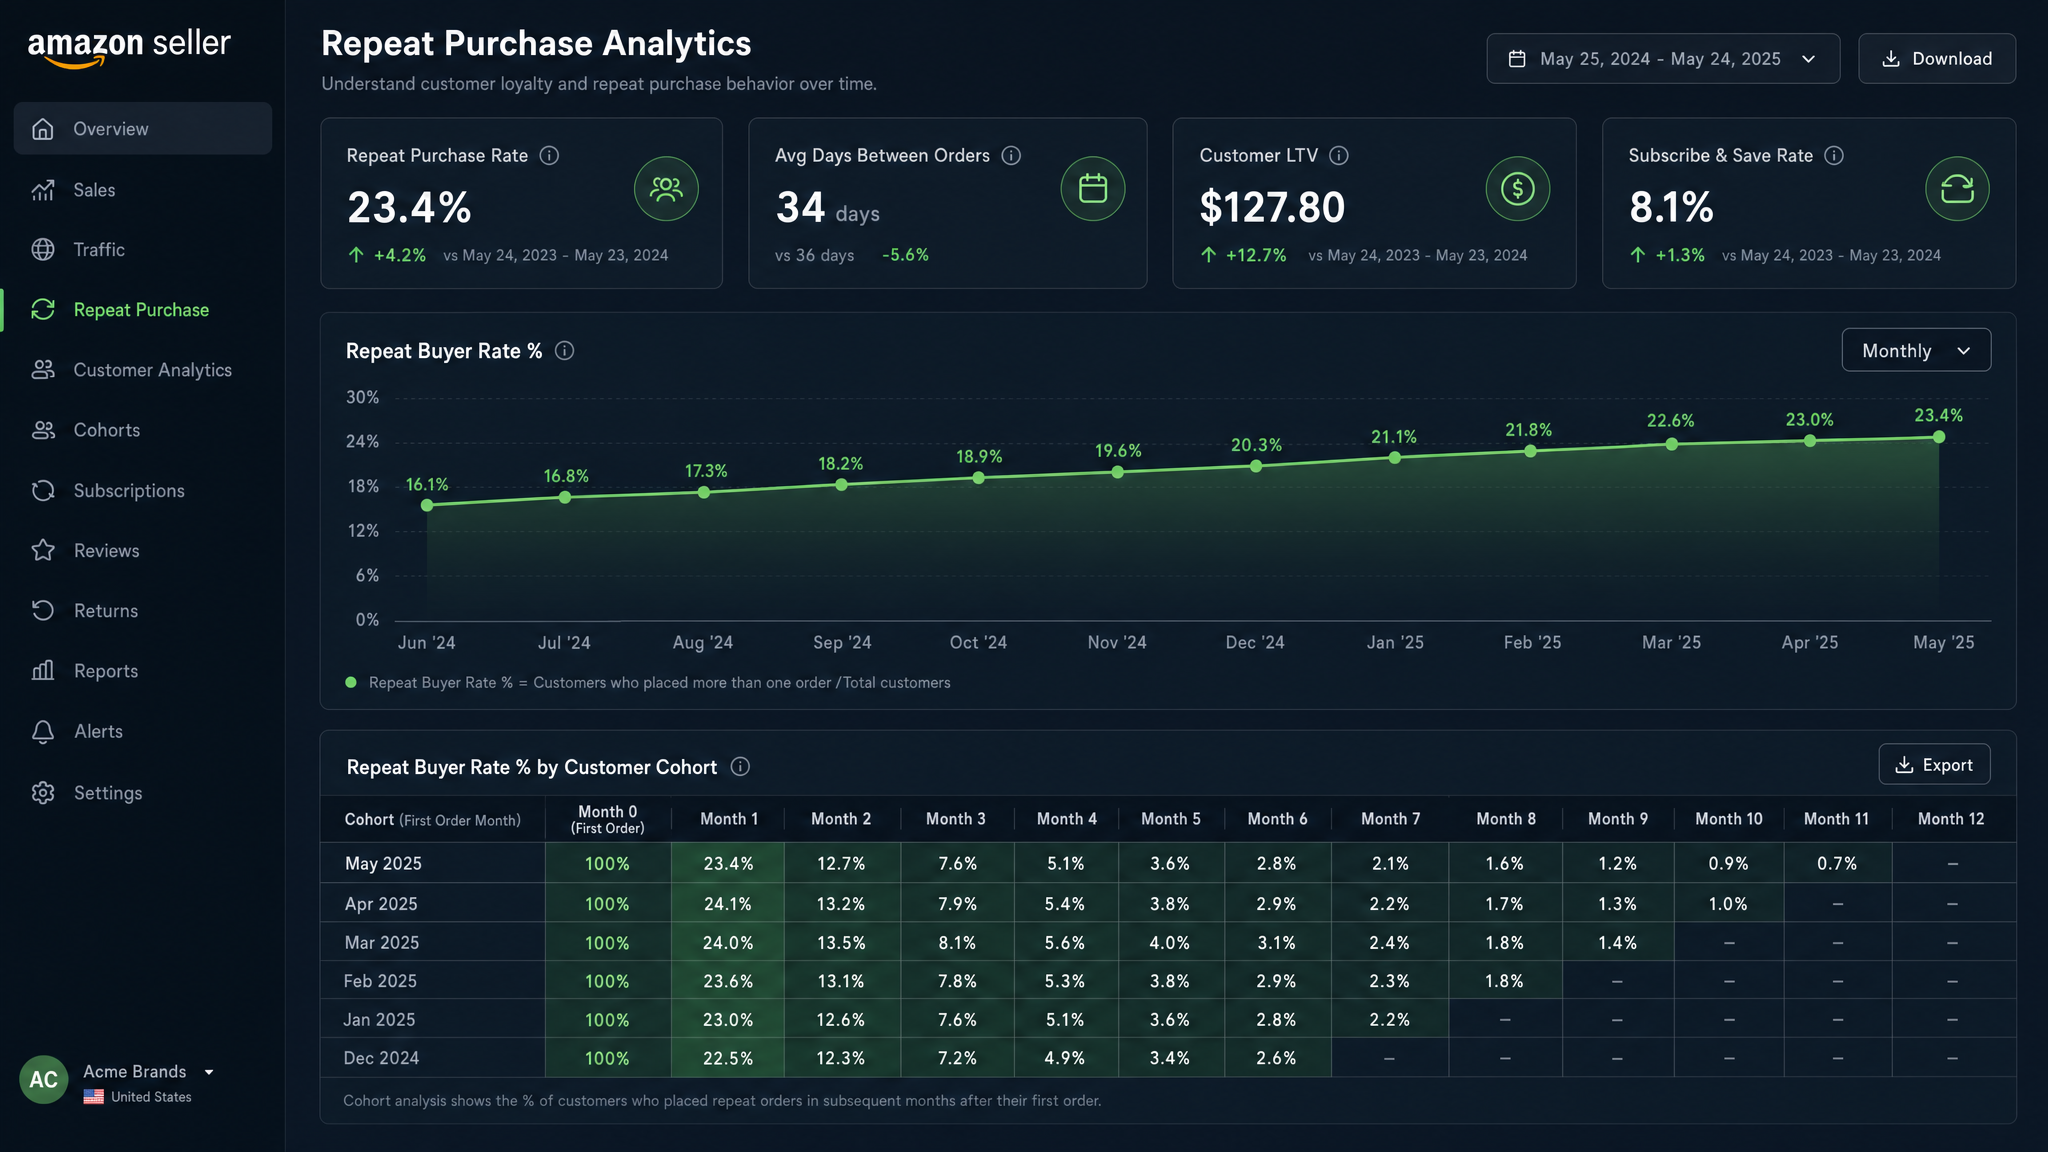
Repeat Purchase Analytics
Visual tracking of repeat buyer rate — what % of customers bought more than once, month-over-month growth trend, repeat purchase interval (days between orders), and LTV by cohort.
Repeat purchase rate is the clearest signal of brand health on Amazon. A seller with 25% repeat buyers is building something defensible. A seller at 3% is on a treadmill of constant customer acquisition. This also tells you if Subscribe & Save is working and whether your product drives real loyalty. Watching this number grow is one of the most motivating dashboards we've built.
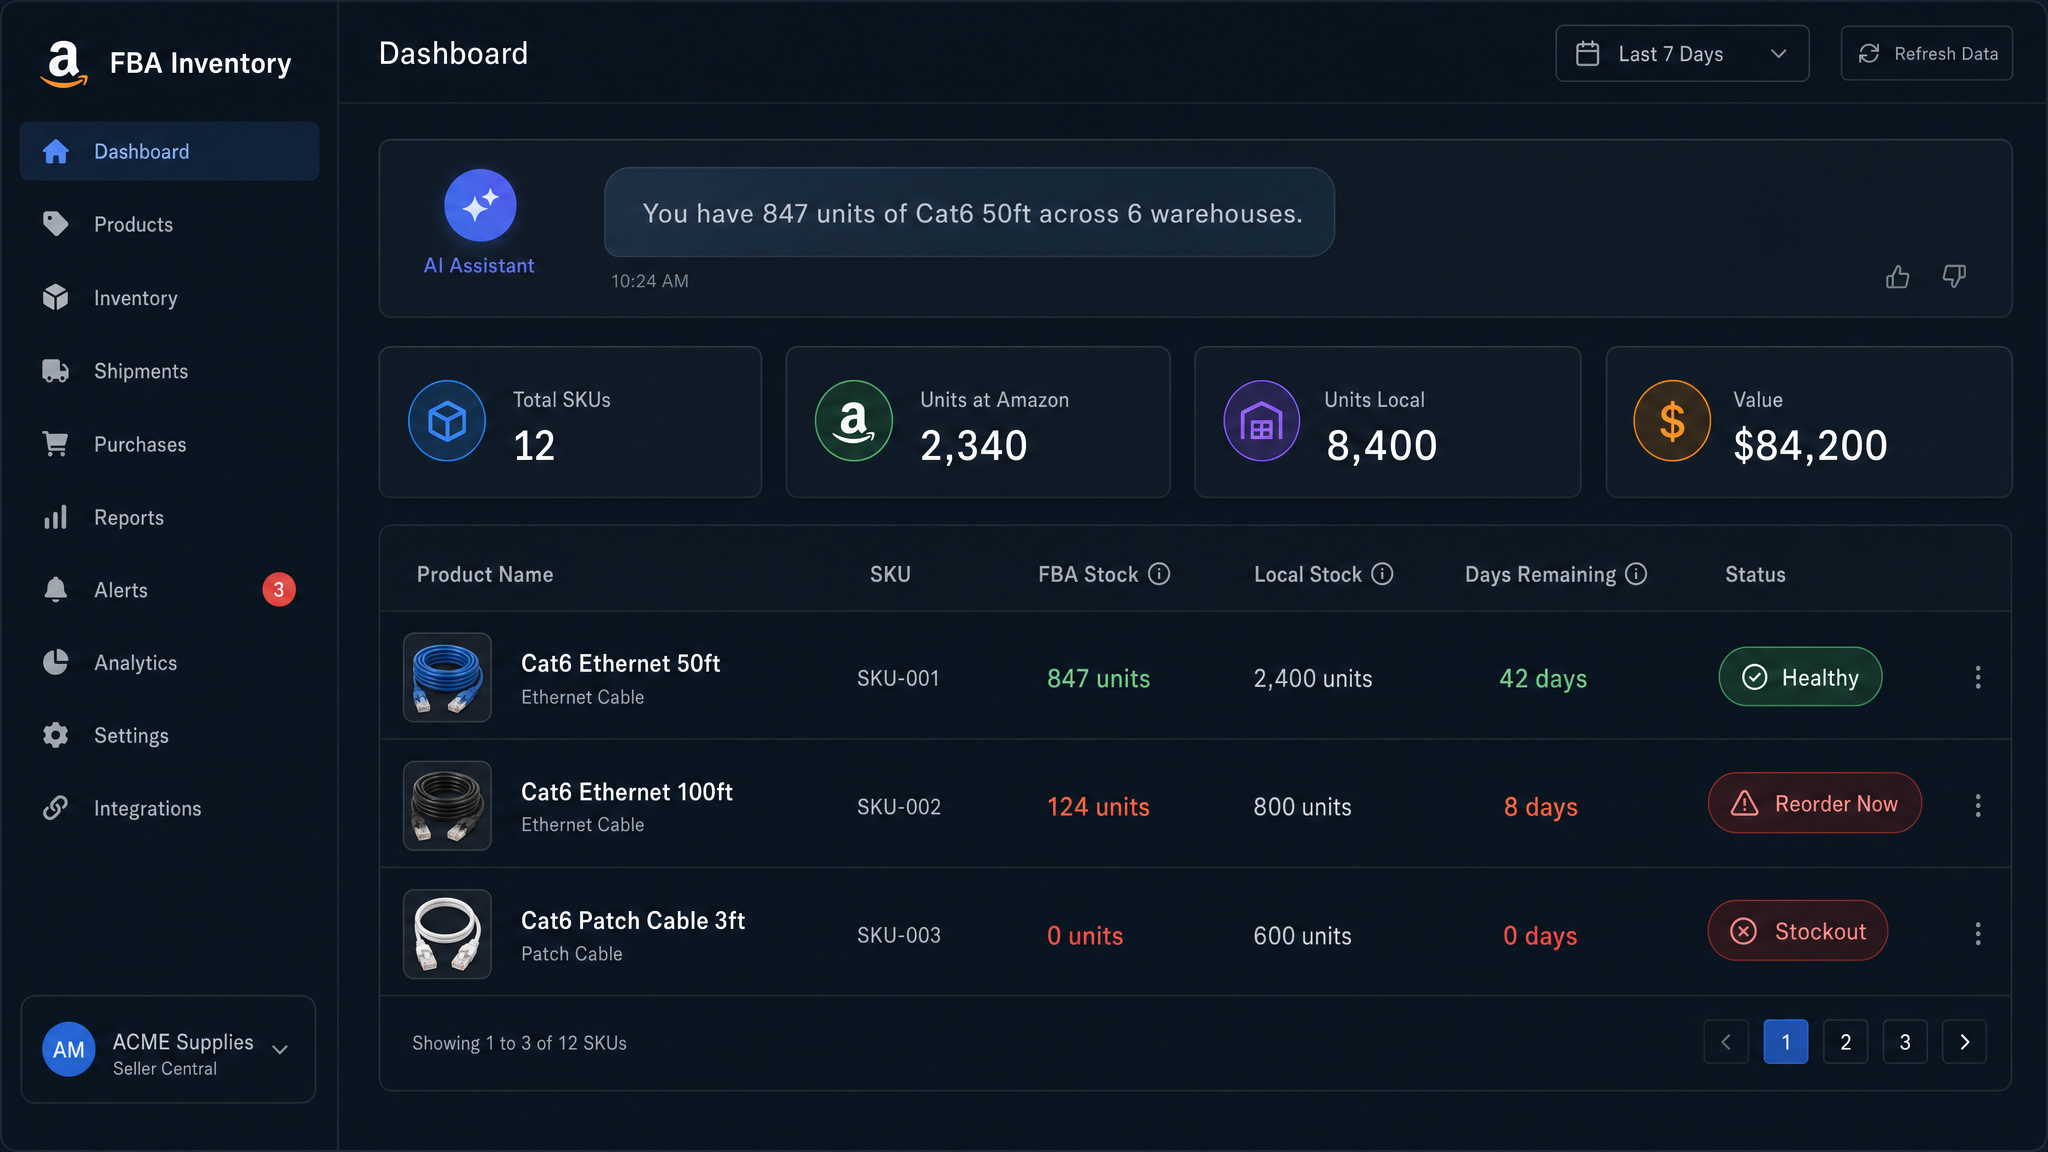
Inventory Management + AI Agent
Live inventory dashboard showing stock levels across all FBA warehouses and your local/3PL warehouse, days of stock remaining per ASIN, and reorder alerts. Includes a full Inventory Audit Tool — compare what Amazon says you have vs what you actually shipped in and flag discrepancies. Powered by a live AI agent you can ask in plain English.
FBA inventory is a black box for most sellers. You shipped 500 units — where are they? Spread across 8 warehouses, several running low. The AI agent makes this conversational: ask "How much Cat6 cable do I have in California right now?" and get an instant answer. The audit tool catches Amazon's inventory discrepancies before they become expensive problems.
Nova — AI Data Integrity Monitor
An autonomous background AI agent that runs every 2 hours, checking all data feeds for staleness or failures. Nova auto-resets stuck jobs, attempts self-healing, and escalates to you only when it can't resolve an issue itself.
Data you can't trust is worse than no data. If your P&L dashboard is showing numbers from 3 days ago, every decision you make is wrong. Nova ensures the dashboard always reflects reality — you never have to manually verify if your numbers are fresh. The AI handles it 24 hours a day, without being asked.
Data Completeness System
A visual tracker showing which months have complete data, with step-by-step instructions for each report type — exactly what to download from Seller Central and where to upload it. Covers all historical report types from Day 1.
Historical analysis requires complete data. Gaps produce wrong trend lines, wrong YoY comparisons, wrong decisions. The completeness system guides you to fill gaps systematically — so when you look at 24 months of growth, you can trust every data point.
Settlement Data Pipeline
Full Amazon settlement import pipeline — every order, refund, fee, adjustment, and reimbursement attributed to the correct month using shipment date, not settlement close date. The difference matters more than most sellers realize.
Most tools use settlement close dates, causing fees from one month to bleed into the next — making monthly P&L inaccurate by design. Our attribution is exact, so P&L reflects what actually happened that month. Critical for tax prep, cash flow planning, and any trend analysis you take seriously.
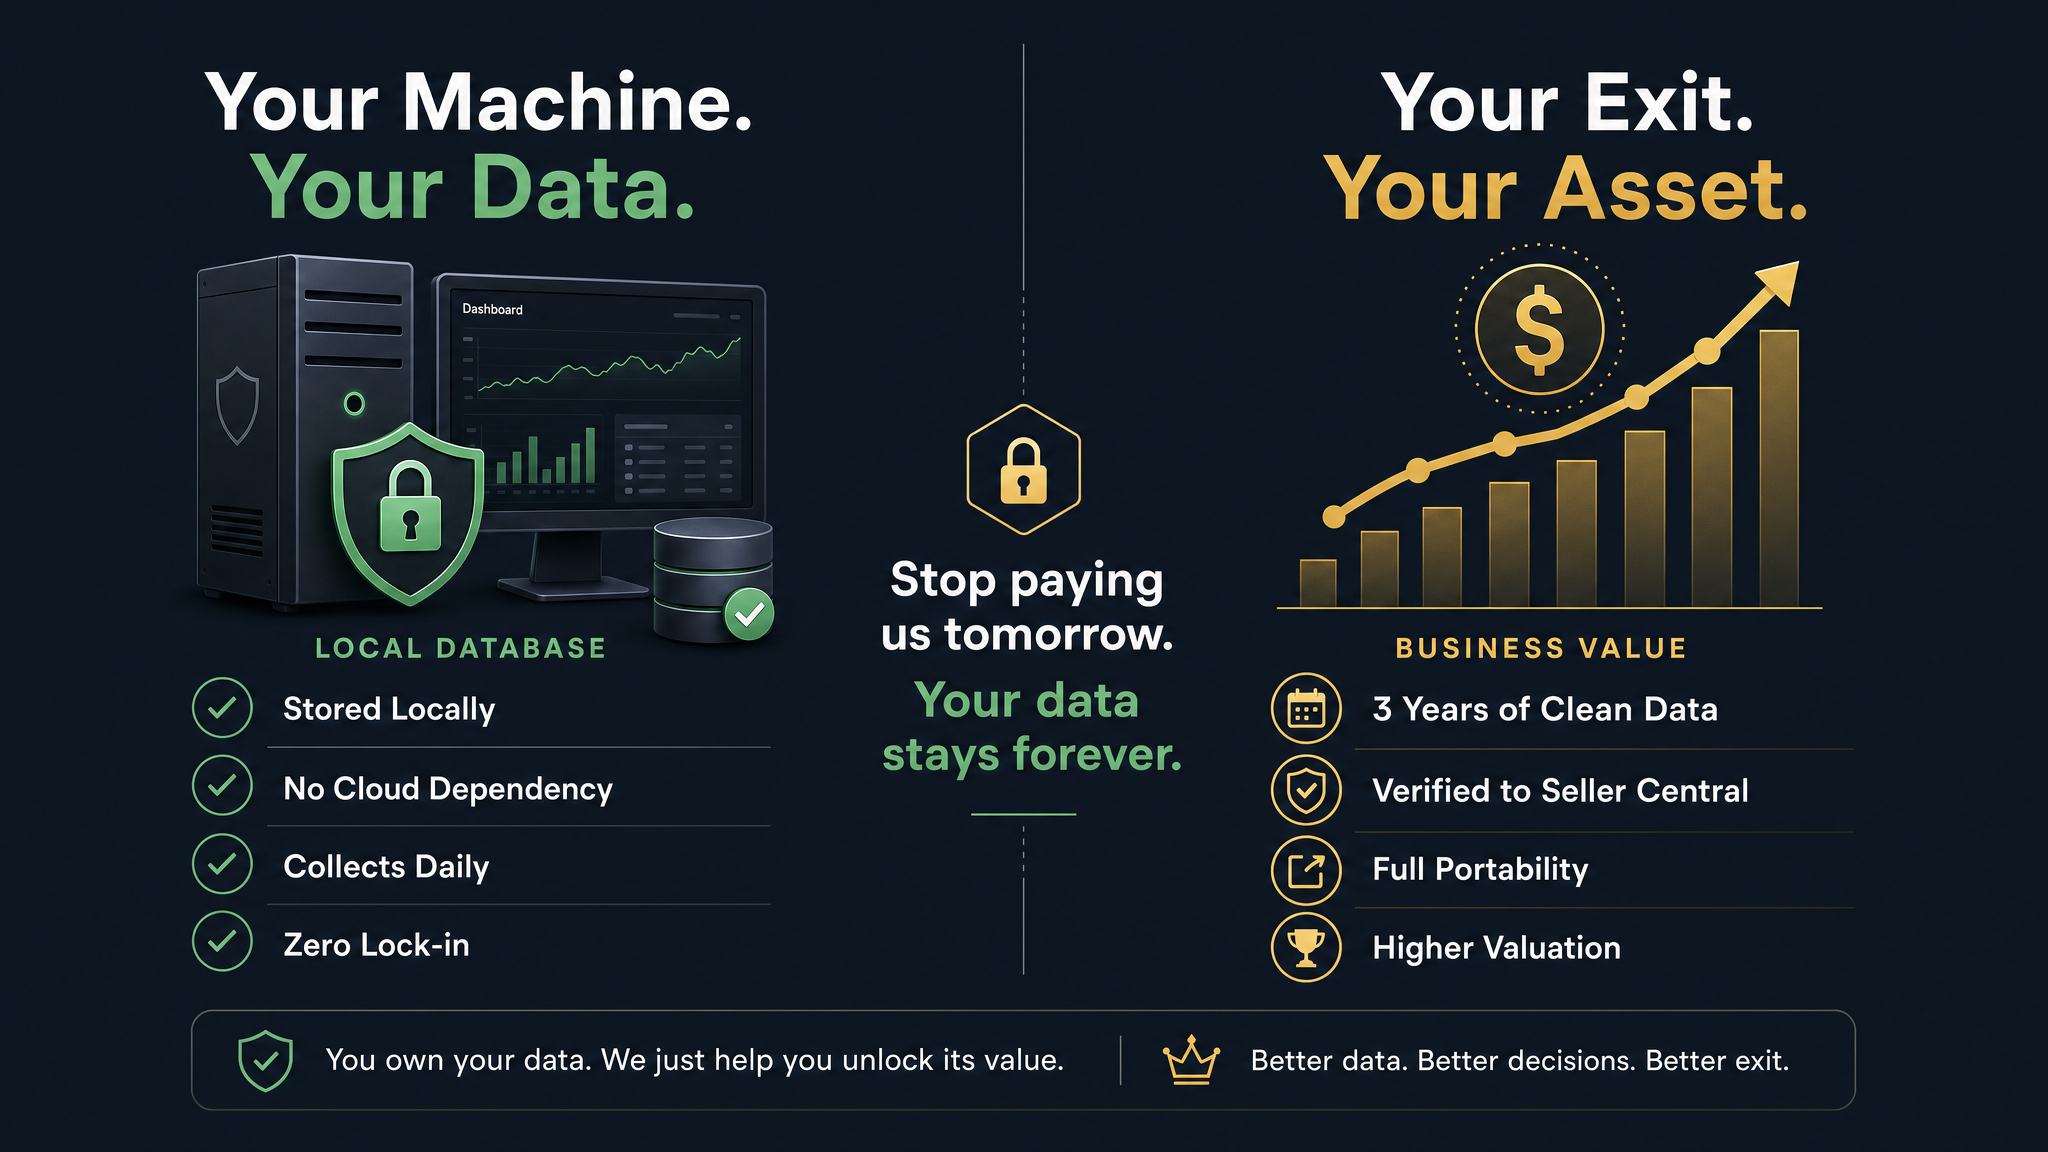
You Own Your Data.
Forever.
Every serious Amazon seller is building toward an exit or a sale. When that day comes, your data is an asset — and we make sure you own it completely.
Every piece of data — every order, every keyword, every ad click, every fee, every return — is stored locally on your computer. Not on our servers. Not on some SaaS platform's database that you lose access to the day you cancel.
Every other Amazon seller tool stores your data on their servers. Stop paying → stop accessing. Our system runs on your machine and collects data daily to your local database. The day you stop working with us, you still have every single data point ever collected. Nothing is held hostage.
The real money in Amazon FBA isn't just monthly profits — it's the exit. Buyers pay multiples based on revenue, profit, and data quality. A seller who hands over 3 years of clean, verified, granular performance data commands a significantly higher valuation than one handing over raw Seller Central exports. Your Mission Control database is part of your business's value.
This isn't a SaaS tool.
It's your system.
Built for your business
Not a generic dashboard with your logo. Mission Control is built from scratch around your specific catalog, margins, and operations.
Connected to your accounts
Direct pipeline from your Seller Central, advertising console, and settlement reports. Your data, live, never estimated.
AI-monitored 24/7
Nova runs every 2 hours to ensure data integrity. You never have to wonder if the numbers you're looking at are accurate.
CFO-level visibility
The financial intelligence most sellers never have — margin waterfall, fee forensics, keyword intelligence, and reimbursement recovery all in one place.
Ready to See What Your
Amazon Business Actually Earns?
Book a $299 strategy session. We'll map out exactly what Mission Control would look like for your business — and show you where the money is going.
Session fee credited toward your build · Builds start at $9,999 · No obligation to move forward